
A Gantt chart is the most familiar picture in project management and the most often misused. Drawn once at kick-off and pinned to a wall, it is decoration — a tidy set of bars that stops matching reality the first week the project slips. Built properly, with real task durations and real dependencies, and updated as work happens, it is the opposite: a live decision-making tool that tells you what must happen next, what is holding the finish date, and where you have promised more than you have.
This article is for the person who plans and runs projects — a project or works engineer in an engineer-to-order, fabrication, EPC or construction business. It explains what a Gantt actually is, how bars and dependencies work, what the critical path means in practice, and how a resource-wise Gantt catches the conflicts the task view hides. If you have not yet broken your project into tasks, start with What is a Work Breakdown Structure? — the Gantt is only as good as the WBS behind it. For the wider picture, see the pillar guide, What is project management software?
The bars on a Gantt are the tasks of a Work Breakdown Structure, and the connector lines are their predecessor dependencies. That is why a Gantt built on a vague task list is useless — there is nothing structured to sequence. Get the WBS right first, and the Gantt almost draws itself.
1. What a Gantt chart actually is
A Gantt chart is a bar chart of a project's tasks against time. Each task is drawn as a horizontal bar; the bar's left edge is the task's start date, its right edge is the finish, and its length is the duration. Stack the tasks down the left and run the calendar across the top, and you have a single picture that answers two questions at once: what is on the project, and when does each piece run.
Read top to bottom, a Gantt is the Work Breakdown Structure — the tasks and their hierarchy. Read left to right, it is the calendar. The reason a Gantt is more useful than a plain list of dates is that it makes two things instantly visible that a list hides: overlap (which tasks run at the same time) and sequence (which task waits for which). Those two properties are the whole point — and they only work if the chart carries real durations and real links, not just start dates typed into a spreadsheet.
2. Task bars and durations — the anatomy of a Gantt
Everything on a Gantt starts with the bar, and a bar is only as honest as the task behind it. A well-formed task bar carries a handful of attributes that together make the schedule trustworthy:
- Left edge = start, right edge = finish
- Length = duration in working days
- Honest durations, not optimistic ones
- A shaded portion showing % complete
- Turns the bar from plan into status
- Rolls up into the project progress
- Who is accountable for the bar
- Who is actually doing the work
- So a slip has a name attached
- Connector lines to the tasks it follows
- Enforce order across the chart
- Move the bar when a predecessor slips
Two duration mistakes cause most bad Gantts. The first is padding every bar "to be safe", which quietly inflates the whole project. The second is the opposite — durations that assume nothing ever goes wrong. A good schedule uses realistic durations and puts the safety where it belongs: in a small buffer on the tasks that actually matter, which the critical path identifies.
3. Predecessor dependencies — what makes it a schedule
A pile of bars with dates is a picture. What turns it into a schedule is dependencies. A predecessor dependency records that one task cannot start (or finish) until another does — you cannot weld before you cut, erect before you fabricate, or commission before you install. Drawn as a connector between two bars, a dependency enforces that order across the whole chart.
The behaviour that matters most is propagation. Because a dependency is a live link, moving one task moves everything that depends on it. Slip the cutting task by two days and the welding, assembly and dispatch bars all shift with it — and the effect on the project finish date appears immediately, on screen, instead of being discovered weeks later when the customer asks why dispatch is late. That single behaviour is why a dependency-aware Gantt is a planning tool and a static chart is not.
The most common dependency is finish-to-start — task B starts when task A finishes — and it covers the majority of real project links. Tools also support start-to-start, finish-to-finish and lags (a gap between the two), but the discipline matters more than the variety: every task that genuinely waits for another should carry the link, so the schedule sequences itself instead of relying on someone remembering the order.
4. Critical path basics
Once tasks are linked, some chains of dependent tasks are longer than others. The longest chain from start to finish is the critical path — the sequence that determines the earliest the project can possibly end. It matters because of one hard rule: a task on the critical path has no slack, so if it slips a day, the whole project slips a day. A task off the critical path has float — room to move within limits without touching the finish date.
Knowing which tasks are critical changes how you manage the project. Instead of pushing every task equally, you protect the critical ones, and you add resource where it actually pulls the finish in — because speeding up a task with float changes nothing. The critical path is not an academic idea; it is the answer to the everyday question "we're behind — where do I put my best crew this week?"
- No slack — a slip here slips the whole project
- The tasks to protect and staff first
- Where adding resource pulls the finish date in
- What to watch on every progress update
- Some room to move without hurting the finish
- Can absorb a delay up to its float
- Lower priority for scarce resource
- Still worth watching — float runs out
5. The resource-wise Gantt
A task Gantt answers "when does each task run". It does not, on its own, answer "do we have the people and machines to run them". Two tasks can sit happily side by side on the timeline and both quietly assume the same welding crew or the same crane in the same week. The task view will never flag it — because it is drawn by task, not by resource.
A resource-wise Gantt re-draws the same schedule by resource: one row per machine, crew or piece of equipment, showing when each is committed across every task and every project running at once. That is the view that reveals over-commitment before it becomes a site clash. Planning with both — the task Gantt to keep the customer's dates in order, the resource Gantt to keep the plan physically possible — is the difference between a schedule that looks right and one that can actually be executed.
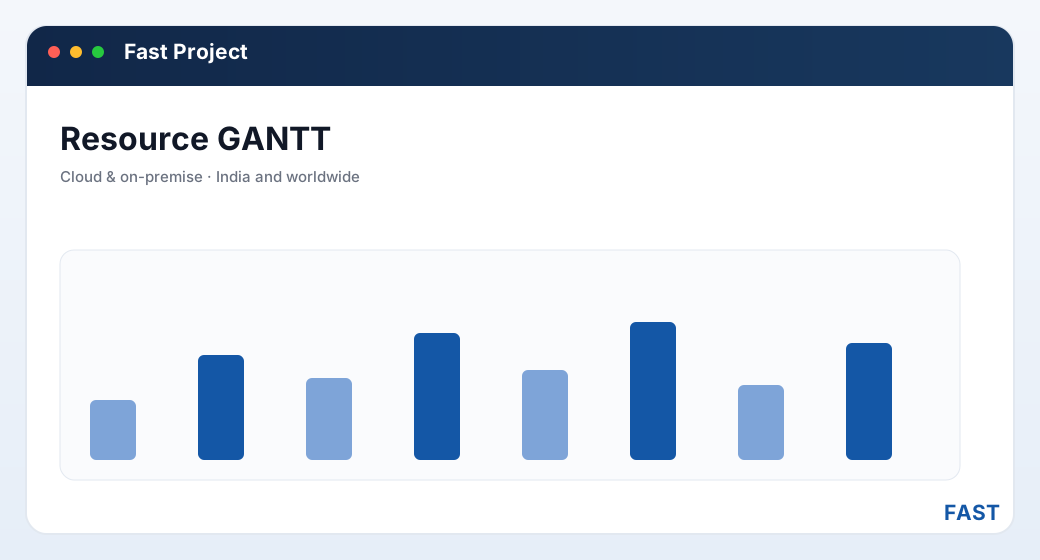
The same schedule, drawn two ways: the task view shows two tasks running in parallel, and only the resource view reveals they both need the same crew at the same time.
6. Keeping the schedule realistic
The best-drawn Gantt decays the moment work starts unless it is kept current. Keeping a schedule realistic is a habit, not a one-off act, and it comes down to a few disciplines:
- Update progress against tasks. Record where each task actually is, so the bars and their progress fills reflect reality — not the plan you drew at kick-off.
- Let dependencies re-flow the successors. When a task slips, don't hand-edit every downstream date — let the predecessor links move the successors and show you the new finish.
- Watch the resource view for over-commitment. Scan for weeks where a crew or machine is booked on two tasks at once, and re-sequence before it becomes a clash on site.
- Keep durations honest. Resist both padding and heroic optimism; a schedule built on wishful durations misleads everyone who reads it.
- Protect the critical path. Give the critical tasks your attention and your best people, because those are the only ones whose slip moves the finish date.
A schedule maintained this way stays a tool people trust and use. One that is drawn once and never touched becomes a wall decoration that quietly diverges from the project it was meant to describe.
7. A worked example — a small fabrication project
To make it concrete, here is a short, deliberately simplified schedule for a fabricated skid package. All numbers below are illustrative — chosen to show how bars, durations and dependencies interact, not drawn from any real project.
| # | Task | Illustrative duration, predecessor and note |
|---|---|---|
1 |
Design & drawings | Duration 4 days · no predecessor · the start of the chain, so any slip here slips everything. |
2 |
Cut & prepare plate | Duration 3 days · after Design · cannot begin until drawings are released. |
3 |
Weld frame | Duration 5 days · after Cut · needs the welding crew — watch the resource view here. |
4 |
Procure & fit valves | Duration 6 days · after Design (runs in parallel with Cut and Weld) · off the critical path, so it has float. |
5 |
Assemble skid | Duration 3 days · after Weld and after Fit valves · waits for the later of the two. |
6 |
Test & dispatch | Duration 2 days · after Assemble · the final bar; its finish is the project finish. |
Trace the chains and the critical path appears: Design (4) → Cut (3) → Weld (5) → Assemble (3) → Test (2) totals 17 illustrative days, while the parallel Design → Procure valves (6) → Assemble branch is shorter. So welding is critical and valve procurement has float. Now slip the welding task by two days: because Assemble, Test and Dispatch all depend on it, they shift, and the project finish moves out by two days — visible the instant you update the Weld bar. That propagation, not the picture itself, is the value of the Gantt.
We never quote real project durations or savings as if they were yours — every plant, project and crew is different. The example above exists only to show the mechanics of bars, dependencies and the critical path. In a demo, we build the same schedule on your tasks and durations, so what you see is real.
8. Two Gantt views in a real project tool
A serious project tool does not offer one Gantt — it offers at least two, because a project has two scheduling questions to answer:
| Aspect | Order-planning Gantt | Resource-wise project Gantt |
|---|---|---|
| Answers | When does each task of this project run? | When is each machine and crew committed? |
| Rows are | Tasks of one project | Resources across all projects |
| Sequenced by | Predecessor dependencies | Resource assignments over time |
| Reveals | Critical path and the finish date | Over-commitment and resource clashes |
| Used to | Keep the customer's dates in order | Keep the plan physically possible |
Neither view is enough alone. The order-planning Gantt keeps a single project's dates coherent; the resource-wise Gantt keeps every project's demands on shared machines and crews honest. Together they let a project business commit to dates it can actually meet.
9. How Fast Project Management does it
Fast Project Management Software is the project and ETO-execution product of the Fast Suite, built in Pune by Improsys under the Fast Technology brand and available cloud or on-premise. It implements scheduling with real, named screens:
| Scheduling capability | How Fast Project Management does it |
|---|---|
| Interactive Gantt | The project view renders a Gantt Chart from the project's tasks — every task laid out as a bar by its start, finish and duration — so the whole schedule is one picture. See Gantt Scheduling. |
| Dependencies | Each task records its predecessor (parent) task within the project; those links define the ordering the Gantt uses to sequence the bars, so the schedule reflects what must precede what. |
| Task attributes | Every bar is backed by a task with an owner, assigned user, priority, dates, budget, progress % and status — so a bar is never just a rectangle. See WBS, Tasks & Dependencies. |
| Two Gantt views | An order-planning Gantt sequences the tasks of a project, and a resource-wise "project Gantt" shows how machines and crews are loaded across everything running — revealing over-commitment the task view hides. |
| Progress & roll-up | As task progress is updated, the bars reflect real status and the project progress rolls up — so the schedule stays a live view, not a kick-off drawing. |
| Resource pricing link | The resources shown on the Gantt are the same machines and crews held in the resource master that prices each task's Bill of Resources — so schedule and cost read from one set of resources. See Resource Management. |
Schedule on the Gantt, resource from the same tasks, bill by milestone.
Fast Project Management runs the whole project layer — project master, WBS tasks and dependencies, an interactive Gantt with an order-planning and a resource-wise view, per-task Bill of Resources, cost estimation and project, milestone and subcontractor billing. Because the resources on the Gantt are the same ones that price the Bill of Resources, schedule and cost never drift apart — and it runs cloud or on-premise.
10. Frequently asked questions
See your project sequenced on a live Gantt
A 30-minute demo — your tasks, your durations, your dependencies and your resources on an interactive Gantt. Cloud or on-premise.